Boise Foreclosures Drop to 6% | May 2014

Boise Foreclosures '12- May '14

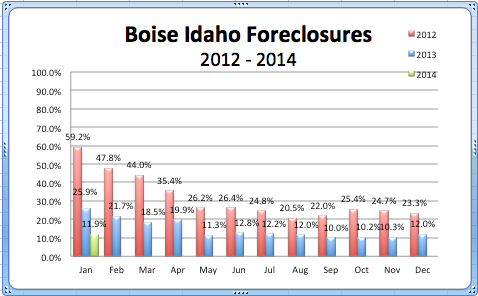
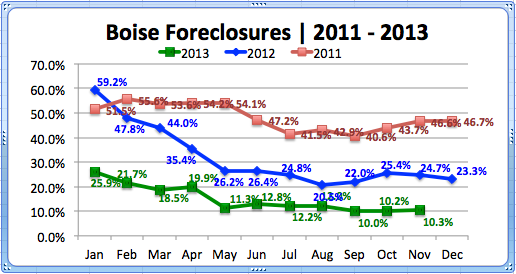
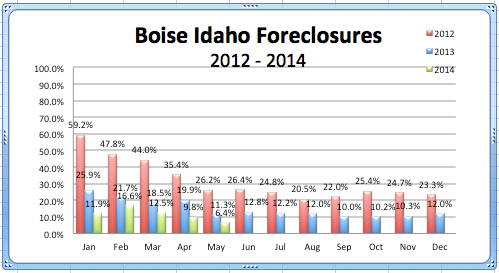
Boise, Idaho foreclosures dropped to 6.4% in May of 2014, the lowest foreclosure rate seen in years. Since February of 2014 the foreclosure rate has dropped by 10%; averaging a 3% decrease each month. In May of 2012 the foreclosure rate was 26.2%, last year it fell by 15% and this May by about 5% from the previous year.

Between 2013 and 2014 (shown above) you can see that there has been a consistent decline of foreclosures into the warmer months of the year hitting with a kind of plateau between May and December.

Total Real Estate Sales '12- '14

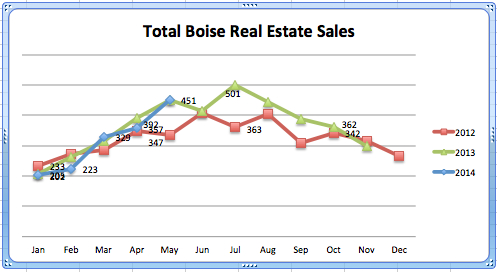
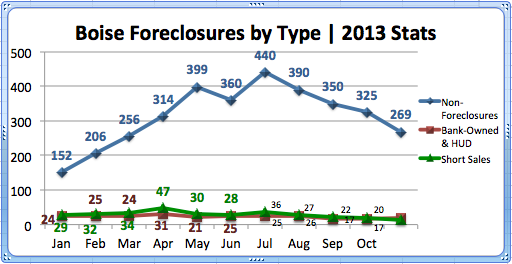
There were 451 homes sold in Boise, May of 2014, slightly higher than the number of homes sold last year and 30% more than in 2012. The graph above characterizes a similar trend in home sales between 2014 and 2013, only varying by 3%.

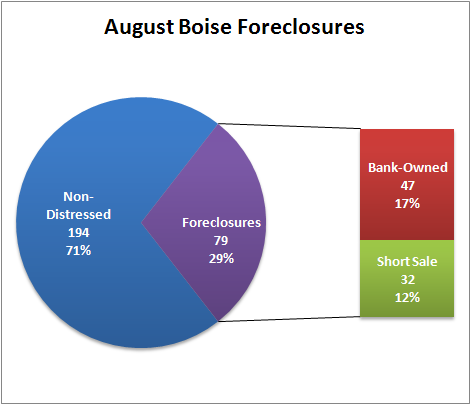
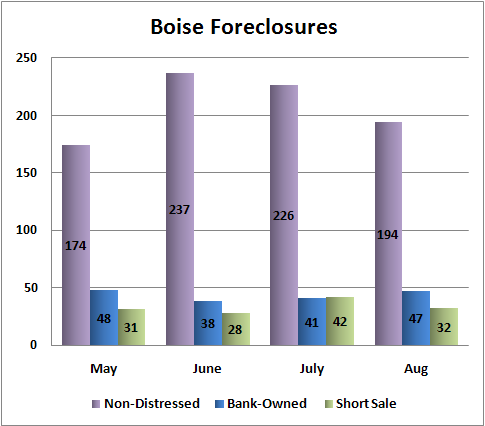
Of the 451 homes sold in Boise, May of 2014, 93% were non-foreclosures, 4% bank owned/HUD, and the remaining 3% short sales. Traditional home sales increased by 31% in May and by 137% from the beginning of the year. Although this is a notable increase, historically sales increase into the warmer months of the year, usually peaking through the summer. As non-foreclosures have increased this year, foreclosures really have not, if anything decreased in the last several months.

Boise Real Estate Sales by type_2014

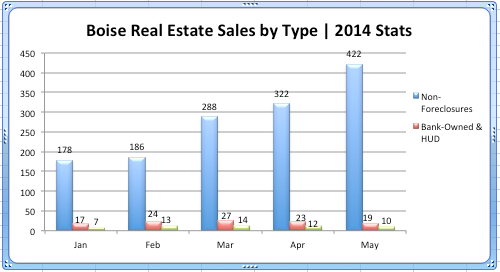
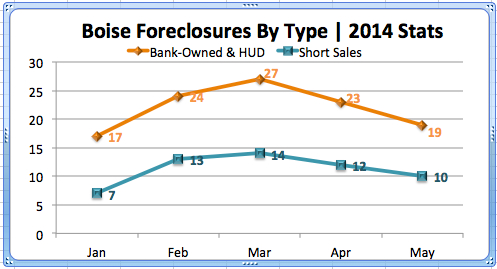
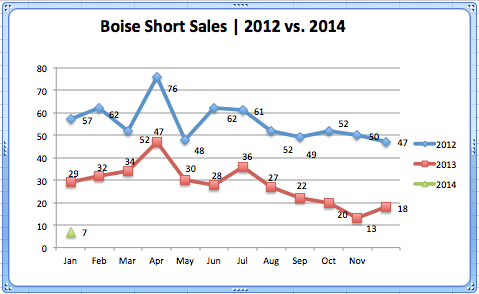
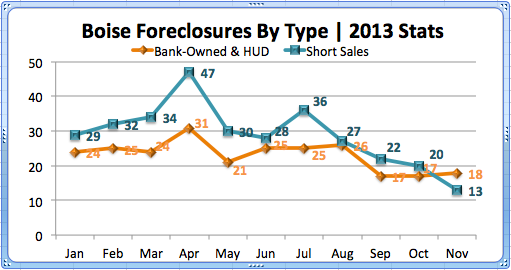
Below you can see that there were 90% more bank-owned/HUD homes sold in May of this year than short sales; also only accounting for 3% of all real estate sales. You can see that there is a similar trend throughout the year with an average of 100% more bank-owned/HUD homes than short sales in 2014.

Boise Foreclosures by type-May, 2014

Disclaimer

Boise Foreclosures Down 14% | January ’14

Boise Foreclosures '12 - '14

The Boise Idaho foreclosure rate was 14% lower in January of ’14, compared to ’13; similarly it was also 47% lower than two years ago. Not only did the foreclosure rate drop from January of last year, but it also dropped from the month before; December ’13 had a foreclosure rate of 12%. As you can see in the graph above, the foreclosure rate dropped significantly May of last year, and has since only varied a couple of percentage points.

As you can see in the graph below, short sales have dropped steadily in Boise starting last summer and continuing until it hit only 7 homes is January ’14. The 7 short sales, marked a 61% drop from the month before in December of ’13. Not only that, but short sales are 75% lower than they were January of last year, and 88% lower than 2012. Short sales have not been this low in Boise in over 5 years.

The short sale average in 2013 was 28 homes per month, and in 2012 it was about 56 per month. The 7 short sales in January really is respectively low compared to the previous yearly numbers and averages.

Boise Short Sales '12 - '14

Bank Owned & HUD home sales are also lower than they were last January; a 29% drop from the 24 bank owned/HUD homes sold the year prior; also a 79% drop from 2 years ago in 2012. The highest monthly number of bank owned/HUD home sales in the last couple of years was in January of 2012, and has since then dropped dramatically. The real estate market has shifted back to health in Boise, and is continuing to get healthier . This is also apparent throughout the county.

Boise Bank Owned:HUD '12 - '14

Disclaimer

Boise Foreclosures | 2013 vs. Previous Years

The foreclosure rate in Boise has continued to drop significantly this year (in addition to the decline we saw last year). January of 2012 started off with a high of a 59.2% foreclosure rate, and dropped all the way down to 23.3% in December. Just one year later, the foreclosure rate has been at a consistent low for the last few months of around 10%. On average in the last two years, the foreclosure rate has dropped 73%, and 59% since 2012. The average foreclosure rate in 2011 was 48.2%, and in 2012 it dropped to 31.7%; the average this year has been 13%.

Boise Foreclosures '11-'13

As you can see in the graph below, short sales accounted for a higher percentage of foreclosures than bank-owned and HUD. This year there have been 257 short sales and 204 bank-owned/ HUD homes sold. On average each month in 2013, short sales accounted for about 9% of real estate sales and bank-owned/ HUD about 6.7%. Combined, 15.7% of this years real estate sales have been either short sales or bank-owned/HUD.

Boise Foreclosures by type '13

Below shows the complete breakdown of real estate sales in 2013. As traditional sales hit their peak mid summer, short sales and bank-owned/ HUD homes did not increase with that climb; instead continued to decrease slightly. In comparison to traditional home sales, short sales and foreclosures have stayed relatively low all year, with decreases since August. The highest was 25.9% of home sales in January and have stayed around 10% the last few months.

Boise Foreclosures by Type '11-'13

Disclaimer

Boise Foreclosures Drop Significantly from 2011

Boise foreclosures accounted for 23.3% of the total home sales in December, a significant drop from one year ago.  In Dec. 2011 the foreclosure market share was 46.7%, a difference of 23.4%.  Overall, distressed sales have been consistently low since May 2012.  The chart below reflects that since May 2012, Boise foreclosures have essentially been cut in half.   When discussing foreclosures in Boise we are referring to short sales and bank-foreclosures.

Boise Foreclosures 2011 vs. 2012

Of the 269 homes sold in December 2012, 62 were foreclosures.  Most of the Boise foreclosures were in the West Boise/Garden City area.  There were 18 total.  The location with the second most was Southwest Boise with 12.  North Boise, which had the third highest total, had 8 foreclosure sales in December.

Short sales were the more dominant type of distressed sale in December.  There were 47 short sales in comparison to 15 bank-owned properties.  That comparison reflects what most of 2012 looked like, with short sales outweighing REO properties.  Still, both are down from one year ago.  For instance, there were 68 short sales in December 2011, 21 more than Dec. 2012 stats.  Also, there were 66 bank-owned and HUD properties sold in Dec. 2011-51 more than Dec. 2012.  The chart below shows the staggering drop in REO properties over the past three years.

Boise Bank-Owned & HUD Sales 2010 - 2012

Disclaimer


Boise Foreclosures Remain Low | November 2012 Stats

Boise foreclosures remained under 27% for the seventh month in a row with November posting 24.7%.  These are some of the lowest numbers we’ve seen since January 2009 (16.8%).  In fact, the average amount of foreclosures sales each month in 2009 was 31.5%.  This year, the average is slightly higher at 32.4%.  More data, though, needs to be collected for December.  Still, the average amount of Boise foreclosures for 2012 is significantly smaller than the previous two years.

Boise Foreclosures 2009 - 2012

The type of foreclosures in Boise have changed slightly over the year as well.  While short sales have remained relatively steady, Boise bank-owned homes have dropped since their 81 sales in January.  During the month of November there were 28, the second lowest total this year.  September had the smallest number at 19.  Those numbers are significantly lower than 2011 where the most of these types of Boise foreclosures in one month was 125 and the lowest was 66.

Boise ID Bank-Owned Homes 2011 vs. 2012

In November, most Boise foreclosures came from West Boise.  In fact, of the 50 short sales this month, 24 were from West Boise.  Also, of the 28 other foreclosures in Boise (REO and HUD), 9 of those sales were in West Boise.  Altogether, West Boise made up 42% of the foreclosure sales for the month of November.


Boise Idaho Foreclosures | 2011

The number of Boise Idaho foreclosures sales were higher for the first eight months of 2011 than for 2010.  However, beginning in August 2011, the number of foreclosures in Boise, Idaho  showed a steady decline through the end of the year.  This is a vast improvement from earlier in the year when foreclosures were as high as, or higher than, any other time in the last 2 years.

Boise Foreclosures | 2010 and 2011

As can be seen in the graph below, the market share of Boise Idaho foreclosures in 2011 were lower than 2010 levels for the last half of the year.  According to Boise market statistics, in June 2011, the market share of Boise foreclosures dropped below 50% for the first time since November 2010.

Market Share of Boise Foreclosures 1.11.12

NE Boise holds the lowest market share with 11%, followed by North Boise and SE Boise.  The remaining areas are closely spaced, ranging between 45% and 54% of the Boise foreclosure market share.

Boise Foreclosure Market Share by MLS Area  1.12.12

Boise Idaho Real Estate | September 09 Market Statistics

Home sales in the Boise Idaho real estate market leaped to its highest level in months during September, with 322 home sales.  This amount is enough to even outpace the summer months, as many people are buying now to get in before the tax credit deadline.  The graph below shows total sales for the Boise Idaho real estate market over the last five months:

Boise Idaho Sales By Month

Of the 322 home sales in the Boise Idaho real estate market, SW Boise-Meridian led the way with 17% of the total, with W Boise-Garden City close behind at 16%.  The entire breakdown of sales is shown in the following graph:

Breakdown of homes sold in Boise, Idaho real estate market

Boise Idaho foreclosures made up 32.9% of all the home sales ( bank-owned sales or Boise ID short sales).  This percentage is up from previous months, as the chart below shows:

Boise Idaho Foreclosures

Data source:  Boise MLS (IMLS).  Information not guaranteed.

Boise Idaho Foreclosures | August ’09

Boise Idaho Foreclosures accounted for 29% of home sales in August. There were 32 Boise short sales (12%) and 47 Boise bank-owned sales (17%) as shown in the graph below.

August Boise Idaho Foreclosures

Some areas of Ada County are influenced more heavily by foreclosures than others. As you can see below, the Boise Idaho foreclosure market had the second lowest market share (29%) while Eagle had the highest (53%). This Boise foreclosure market share is about even with the previous three months.

Boise ID August Foreclosures

In the Boise real estate market, 273 homes sold during the month of August, this number is only a bit less than the previous two months when 309 homes sold in July, and 303 homes sold in June. In August, the median home sold price was $171,500 and the average home sold price was $201,234.

Boise Foreclosures

Start your search for Boise Idaho foreclosures now.

Information deemed reliable but not guarenteed.

Boise Foreclosures make it #27 in the Country

According to Realtytrac, the four states with the highest foreclosures are Nevada, Arizona, California, and Florida.  These states account for the top 26 cities for foreclosure rates.  The Boise Metro area makes the list at #27 with one foreclosure notice for every 85 households.  The top city, Las Vegas, has 1 foreclosure notice for every 22 households.

Search Boise short sale properties on this website or request a free list of bank-owned real estate.

Information not guaranteed.