Boise Foreclosures Down 14% | January ’14

Boise Foreclosures '12 - '14

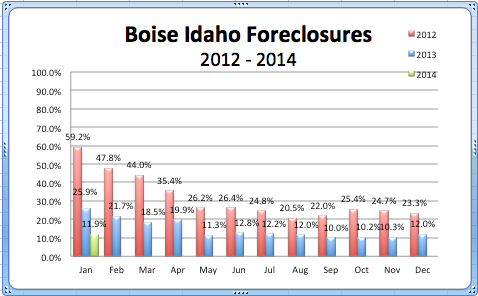
The Boise Idaho foreclosure rate was 14% lower in January of ’14, compared to ’13; similarly it was also 47% lower than two years ago. Not only did the foreclosure rate drop from January of last year, but it also dropped from the month before; December ’13 had a foreclosure rate of 12%. As you can see in the graph above, the foreclosure rate dropped significantly May of last year, and has since only varied a couple of percentage points.

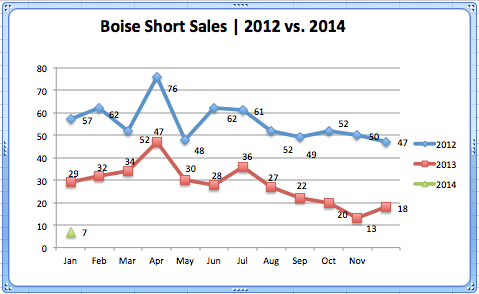
As you can see in the graph below, short sales have dropped steadily in Boise starting last summer and continuing until it hit only 7 homes is January ’14. The 7 short sales, marked a 61% drop from the month before in December of ’13. Not only that, but short sales are 75% lower than they were January of last year, and 88% lower than 2012. Short sales have not been this low in Boise in over 5 years.

The short sale average in 2013 was 28 homes per month, and in 2012 it was about 56 per month. The 7 short sales in January really is respectively low compared to the previous yearly numbers and averages.

Boise Short Sales '12 - '14

Bank Owned & HUD home sales are also lower than they were last January; a 29% drop from the 24 bank owned/HUD homes sold the year prior; also a 79% drop from 2 years ago in 2012. The highest monthly number of bank owned/HUD home sales in the last couple of years was in January of 2012, and has since then dropped dramatically. The real estate market has shifted back to health in Boise, and is continuing to get healthier . This is also apparent throughout the county.

Boise Bank Owned:HUD '12 - '14

Disclaimer

Boise Idaho Foreclosures Decline | June 2012

The successful purchase of Boise Idaho foreclosures has been getting much more competitive as inventories decrease.  As can be seen below, there were fewer sales of foreclosure properties in June 2012 than at any other time since foreclosure records have been kept by the Intermountain MLS.  In 2011, the Boise Idaho foreclosure market share stayed mostly between 25% and 40%, and the beginning of 2012 was no exception even though February 2012 showed a decrease of 10 percentage points to a 25% market share.  Since March 2012, however, we’ve seen a steady and dramatic decline.

Boise Idaho Foreclosures | Year Over Year Comparison

In June 2012, there were 406 home sales in Boise.  Of this total, only 45 were Boise ID foreclosures, resulting in an 11.1% market share.  Non-foreclosure properties constituted 73.7%.  The remaining 15.2% were Boise ID short sales, also known as pre-foreclosures.

Boise Idaho Foreclosures vs Non-Foreclosures Thru June 2012

Even though total sales have steadily increased since the beginning of the year, the market share of Boise ID foreclosures has decreased, resulting in more multiple-offer situations than ever before. Buyers can still get a good value for their home-buying dollar with Boise Idaho foreclosures, but they may need to be more aggressive when making an offer.

If you have any questions about Boise Idaho foreclosures, feel free to contact us.

disclaimer

Boise Idaho Foreclosures | 2011 vs 2010

There were more Boise Idaho foreclosure sales (short sales, bank-owned and HUD properties) in 2011 than 2010.  The areas with the largest increase in foreclosures were West Boise/Garden City with a 34% increase, and the Boise Bench with a 40% increase.  The only areas having fewer foreclosures in 2011 than 2010 were North Boise with -13%, Garden City with -12%, NE Boise with  -9%, and SW Boise/Meridian with -2%.  Boise Idaho foreclosures in the remaining areas–South, SE, West and NW–increased between 20% and 26% in 2011.

Boise Foreclosure Sales by Area | 2011 vs 2010

As can be seen in the graph below, non-foreclosure sales for 2011 increased throughout Boise, with the largest increases being in SW Boise/Meridian and NE Boise.  Whereas these two areas showed slight decreases in Boise Idaho foreclosures in 2011, the number of non-foreclosure sales in 2011 for these two areas increased over 2010 by 79% and 78%, respectively.

Boise Non-Foreclosure Sales by Area | 2011 vs 2010

The Boise Bench, NW and W Boise all showed increases between 20% and 28% over 2010, while South, SE and W Boise/Garden City showed increases between 10% and 14%.  The remaining two areas, Garden City and North Boise, while showing decreases in foreclosure sales in 2011, stayed fairly consistent with 2010 non-foreclosure sales.

disclaimer

Boise Idaho Foreclosures | 2011

The number of Boise Idaho foreclosures sales were higher for the first eight months of 2011 than for 2010.  However, beginning in August 2011, the number of foreclosures in Boise, Idaho  showed a steady decline through the end of the year.  This is a vast improvement from earlier in the year when foreclosures were as high as, or higher than, any other time in the last 2 years.

Boise Foreclosures | 2010 and 2011

As can be seen in the graph below, the market share of Boise Idaho foreclosures in 2011 were lower than 2010 levels for the last half of the year.  According to Boise market statistics, in June 2011, the market share of Boise foreclosures dropped below 50% for the first time since November 2010.

Market Share of Boise Foreclosures 1.11.12

NE Boise holds the lowest market share with 11%, followed by North Boise and SE Boise.  The remaining areas are closely spaced, ranging between 45% and 54% of the Boise foreclosure market share.

Boise Foreclosure Market Share by MLS Area  1.12.12

IHFA Buying Idaho Foreclosures

The Idaho Housing and Finance Association has a new program to buy Idaho Foreclosures, renovate, then resell them at cost.  The total budget is $13.5 million with largest share going to Ada & Canyon County ($10 million).  A study was done to determine where Idaho foreclosures had the most impact by zip code:

1. Nampa 83687

2. Caldwell 83605

3. Nampa 83686

4. Nampa 83651

5. Meridian 83642

6. Caldwell 83607

7. Twin Falls 83301

8. Boise 83709

9. Kuna 83634

10. Post Falls 83854

Source: Idaho Housing and Finance Association

Search for Boise Idaho Foreclosures here.

You can get the more information on this plan to buy Idaho Foreclosures here.

Information not guaranteed.